
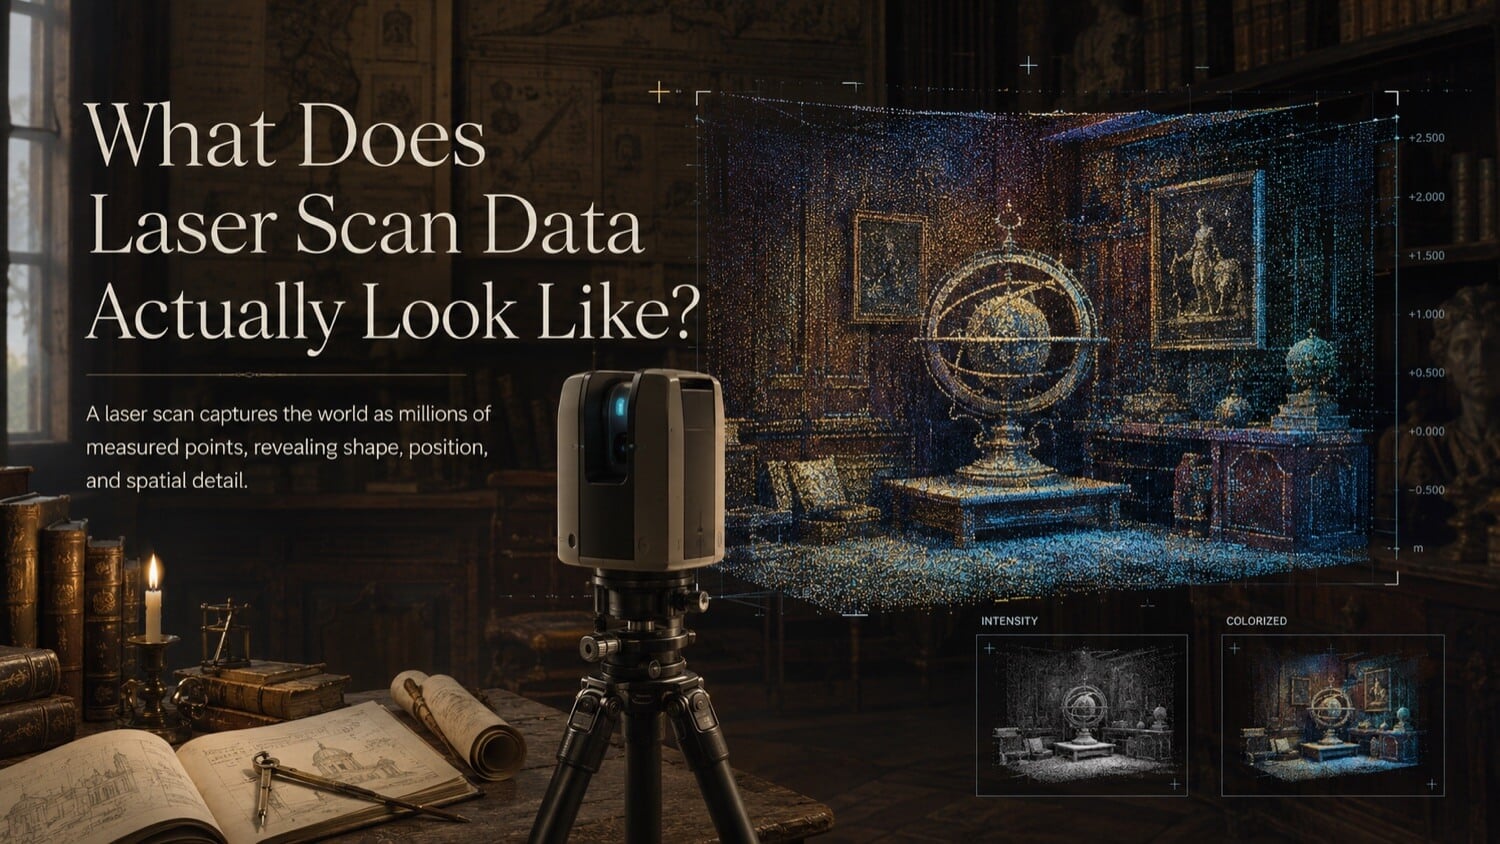
The most common first reaction from engineers and project managers encountering raw 3D laser scan data for the first time is that it looks like a ghostly, translucent cloud, not a solid model. That is an accurate description, and understanding why scan data looks the way it does is the key to understanding how to use it effectively.
How GDS Can Help
Most physical-to-digital projects touch more than one discipline. GDS can support the workflow from field capture through usable engineering deliverables with 3D laser scanning, 3D modeling, reverse engineering, and consulting.
GDS lists coverage across major metropolitan areas including Houston, Dallas, San Antonio, Austin, Los Angeles, San Diego, San Jose, Long Beach, Fort Worth, Irvine, Riverside, New Orleans, Baton Rouge, Shreveport, Las Vegas, and Beverly Hills. See the current GDS locations page for posted service areas.
Scope note: Specific tolerances, certification requirements, deliverables, schedules, reports, site control, and acceptance criteria should be defined in the quote, proposal, or statement of work for the individual project.
Not a Photo, Not a CAD Model , Something Entirely Different
Raw 3D laser scan data is a point cloud: a dense collection of individual 3D coordinates, each one marking the precise location in space where a laser pulse bounced off a physical surface. Because empty space exists between each recorded coordinate, the entire dataset appears semi-transparent when rendered on screen. Engineers can look directly "through" structural walls and observe the pipe racks behind them, or rotate the model and see completely through the floor to view underground piping.
This translucency is not a rendering artifact, it is a fundamental property of the data structure. It is also an engineering advantage: complex, overlapping systems that would be invisible in a solid 3D model are fully navigable in point cloud form.
The Three Visual Stages of Scan Data
GDS guides raw scan data through three distinct visual and functional stages as a project progresses from field capture to final engineering deliverable.
Stage 1 , The Point Cloud (The Coordinates)
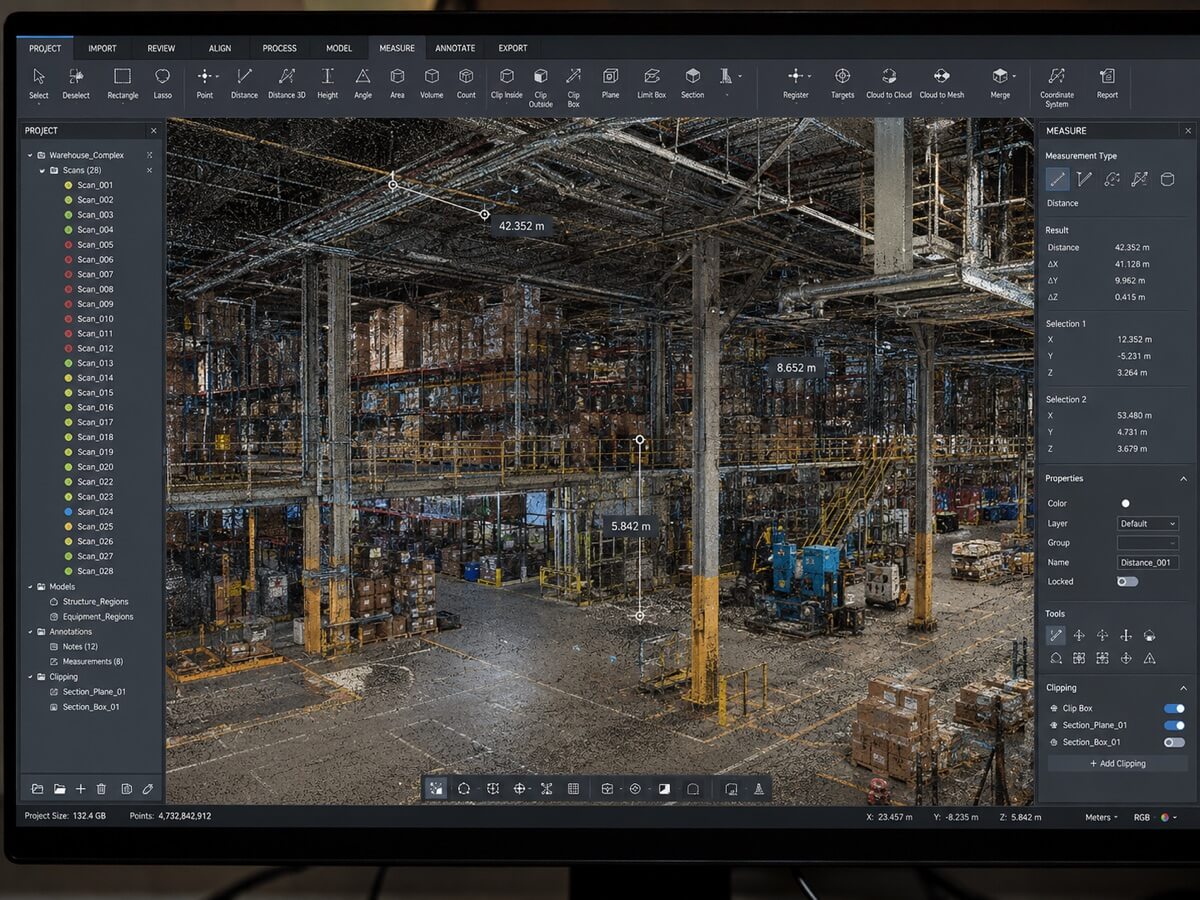
The raw output of any laser scanner is the point cloud. In a large-scale facility scan, this dataset may contain 2 to 10 billion individual coordinate points spread across the project footprint. When loaded into a point cloud viewer such as Autodesk ReCap or Leica Cyclone TruView, the result resembles a luminous, three-dimensional digital photograph that can be rotated, sliced, zoomed, and measured.
Point clouds are navigable in real time in modern viewers, and engineers can extract precise dimensions directly from the cloud, measuring pipe center-to-center distances, checking clearances, and verifying elevations while reducing the need for repeat site visits.
Stage 2 , The Mesh (The Skin)
When a point cloud is processed for additive manufacturing, deviation analysis, or reverse engineering, software draws flat triangular faces between adjacent coordinate points, sealing the cloud into a continuous, opaque surface called a polygon mesh. The mesh looks like a solid object, walls appear as solid walls, pipes as solid cylinders, but the underlying data structure is still a surface shell with no parametric intelligence.
At this stage, the model captures the physical reality of the scanned environment exactly as it existed at the moment of scanning: every warp, dent, corrosion pocket, and as-built deviation is preserved in the triangulated geometry.
Stage 3 , The Parametric CAD Model (The Solid)
The final engineering deliverable for most industrial projects is a parametric solid model: a mathematically defined, fully editable 3D geometry in STEP, Parasolid, or native CAD format. A CAD engineer uses the mesh as a precise 3D tracing template, rebuilding the asset feature-by-feature with correct tolerances, standard dimensions, and manufacturing-ready geometry.
Unlike the point cloud or mesh, the parametric solid can be directly consumed by CNC CAM software, FEA analysis packages, and engineering drawing generation workflows.
Reflectance Intensity Mapping
Beyond spatial coordinates, industrial scanners measure the reflectance intensity of every laser return, the percentage of emitted laser energy that bounces back to the scanner. This value is mapped to each point coordinate and rendered as a grayscale gradient:
| Surface Type | Intensity Behavior |
|---|---|
| Polished metal, reflective tape | High intensity (bright white) |
| Painted steel, concrete | Medium intensity (mid-grey) |
| Dark rubber, charred surfaces | Low intensity (dark grey/black) |
| Transparent glass, water | Near-zero return (data gap) |
By rendering the point cloud using intensity values, GDS produces a scan dataset that resembles a high-contrast black-and-white photograph of the facility, readable enough for engineers to identify equipment nameplates, read pipe schedules, and locate weld seams, even in areas captured in complete darkness.
True-Color (RGB) Point Cloud Rendering
When color scanning is specified, industrial scanners integrate high-resolution digital cameras into the scan setup. Photographic imagery is captured at each scanner position and projected onto the point cloud coordinates, assigning each point an RGB color value derived from the photograph.
The result is a true-color point cloud that renders the facility with photorealistic visual fidelity, every painted equipment color, safety marking, and signage label is visible in the 3D model. Color scanning adds field time to each setup but delivers a significantly more intuitive visualization tool for client review and project coordination meetings.
How GDS Delivers Scan Data for Review
GDS can provide several delivery options based on client hardware, software access, and project requirements:
1. Local File Delivery (.e57 / .rcp): Full-fidelity datasets delivered on external SSD or secure cloud transfer, ready for import into Revit, AutoCAD, or PolyWorks. 2. Autodesk ReCap Project (.rcp/.rcs): Pre-indexed projects that load instantly in ReCap without conversion. Optimized for teams already working in the Autodesk ecosystem. 3. Cloud-Hosted HTML5 Viewer: When scoped, GDS can upload the registered dataset to a secure hosted viewer. Clients navigate, measure, and annotate the 3D scan data in a standard web browser with no software installation required, shifting all processing load to GDS infrastructure.
Quick Facts
Continue Reading
The next best article depends on where you are in the project. These suggested reads connect this topic to the next practical decision your team is likely to face.
FAQ
Is a point cloud the same as a 3D photo?
No. A photograph captures color and light on a 2D plane. A point cloud captures precise X, Y, Z spatial coordinates in three dimensions. While intensity-mapped or color-rendered point clouds can look photorealistic, the underlying data is a set of measurable 3D coordinates, not pixels.
Can I take measurements directly from scan data?
Yes. Point cloud viewers such as Autodesk ReCap and Leica Cyclone TruView include built-in measurement tools. Engineers can extract pipe centerlines, check clearances, measure equipment elevations, and verify distances directly from the registered point cloud without visiting the physical site.
Does GDS provide a viewer so I can review scan data without special software?
Yes. GDS offers a cloud-hosted HTML5 viewer option that allows clients to navigate, measure, and annotate 3D scan data in a standard web browser. When a hosted viewer is included in the scope, teams can review scan data in a browser without installing specialized point-cloud software.
Want to See Your Facility in 3D?
GDS delivers registered, true-color point clouds and cloud-hosted viewers so your entire team can navigate your facility from any browser , no special hardware required.